Bond Portfolio
The basic philosophy of the Bond Portfolio is that (i) interest rates are cyclical based on the economic cycles – which provides opportunity for duration management, and (ii) sectors are cyclical based on the technical factors within the bond market (i.e. corporate credit, prime mortgage securities, and US Treasuries). By managing the duration and sector exposure actively, it is possible to beat out the common bond market benchmarks without taking additional risk (as measured by volatility).
GCG strives to take sectoral and duration market overweight and underweight exposures relative to the Barclays Aggregate Bond Index (“BABI”) on an active basis with the objective to consistently beat the BABI by 1% to 2% per annum over a 1 year period while containing risk exposure. On occasion, the Bond Portfolio may go short duration during periods of anticipated Federal Reserve credit tightening as those periods tend to be ones associated with potential negative returns for the BABI. The investment objective of the Bond Portfolio is an absolute return strategy.
Typically, the Bond Portfolio employs tactical allocations to “beta” long only low fee mutual funds (and occasionally short-biased ETFs) made up of Investment Grade Corporate, GNMA Mortgages (government guaranteed), and US Treasuries (specifically, initially 7 Vanguard funds – Corporate (short-, medium-, and long-term); GNMA Mortgage; and US Treasury (short-, medium, and long-term) funds. At times, short-biased bond ETFs may be utilized to hedge or position in declining bond markets environments. A separate version of this strategy including allocations to Municipal bond funds will be available soon for taxable accounts that desire tax-free allocations.
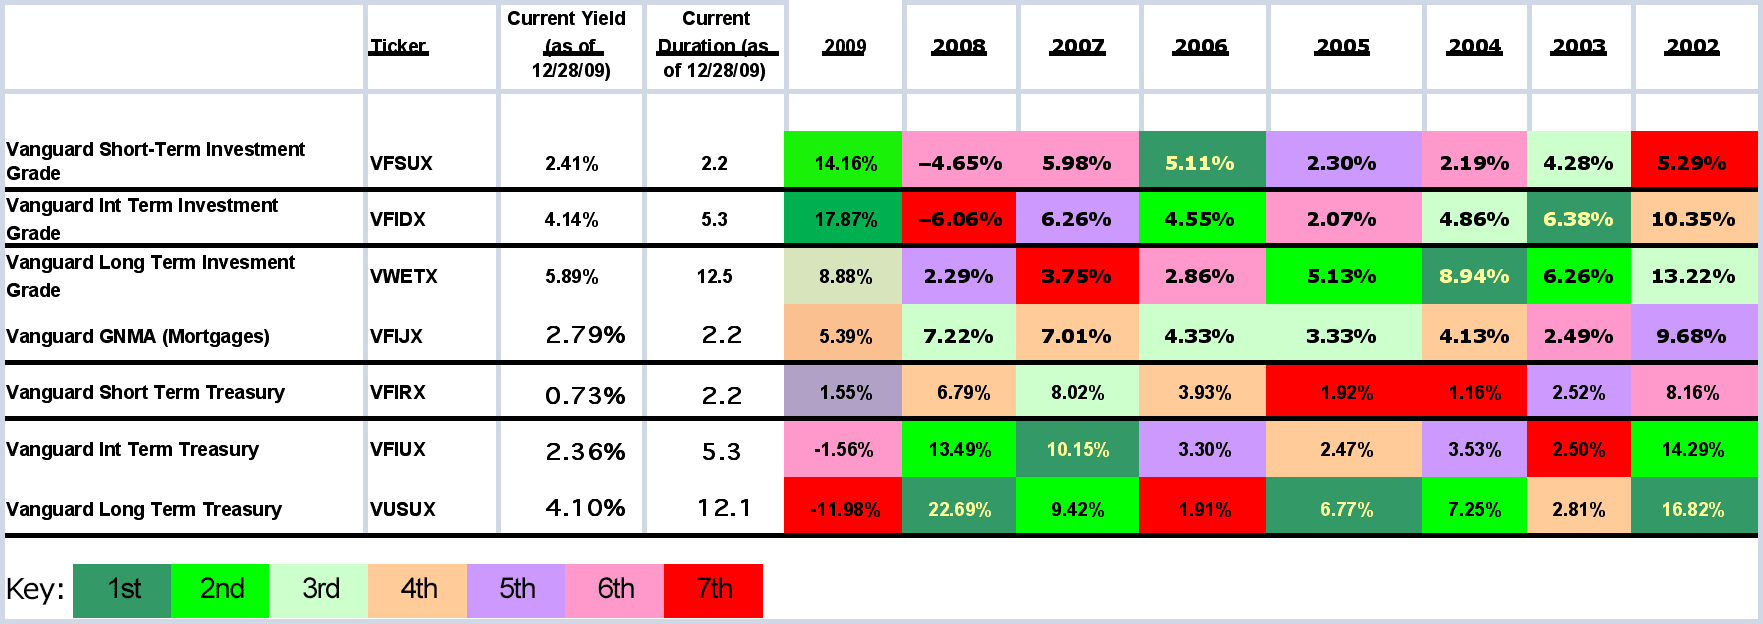
As an example of the cyclicality prevalent within the bond markets, see the below color-coded table showing the top (green) to bottom (red) performers each year of the Vanguard mutual funds typically employed as a core part of the Bond Portfolio. As witnessed by the “jumpiness” of the both the red and green colors on the table, the cyclicality is evident, especially in stressed markets such as 2008 and recovery markets such as 2009. The performance of each fund for the calendar year is also noted.
Vanguard Fund Performance for Selected Bond Funds since 2002
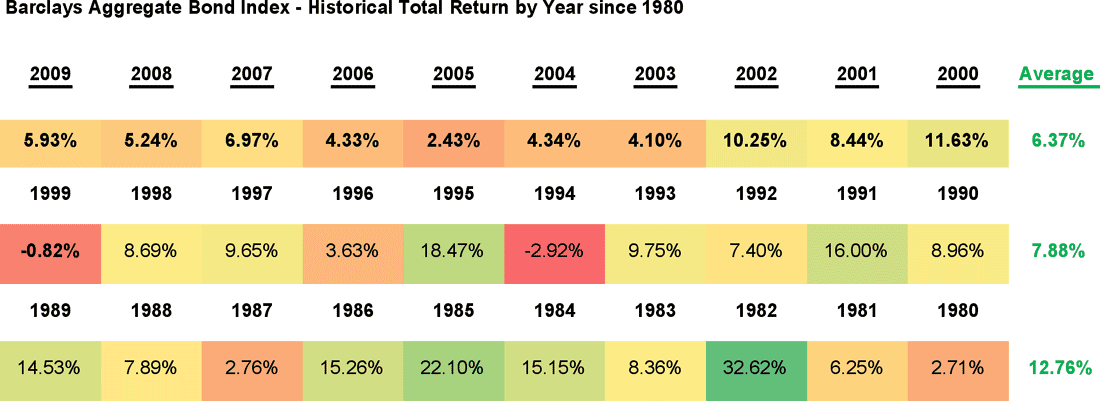
Similarly, in analyzing the Barclays Aggregate Bond Index returns historically, it is apparent that bond market total returns are cyclical based mostly on overall interest rate movements. High interest rates in the 1980’s and subsequent drops (the Volcker years) resulted in phenomenal bond market performance in the early 80’s, but the 1990’s proved to be more subdued performance as inflation came down in the Greenspan years, and the 2000’s have been even more subdued in terms of bond market performance. The only negative performance years since 1980 were 1994 and 1999, both years where the Federal Reserve took an aggressive rate hiking stance in an attempt to avoid inflationary pressures (in 1994 there was the risk of inflation from low rates over the past 3 years while in 1999 there was asset price inflation from bloated equity markets).
Barclays Aggregate Bond Index Total Return Performance since 1980
For further details download a copy of our Investment Advisory Services presentation on this page.
Gramercy Consulting Group LLC is a registered investment adviser in the State of Washington. The adviser may not transact business in states where it is not appropriately registered, excluded or exempted from registration. Individualized responses to persons that involve either the effecting of transaction in securities, or the rendering of personalized investment advice for compensation, will not be made without registration or exemption.


